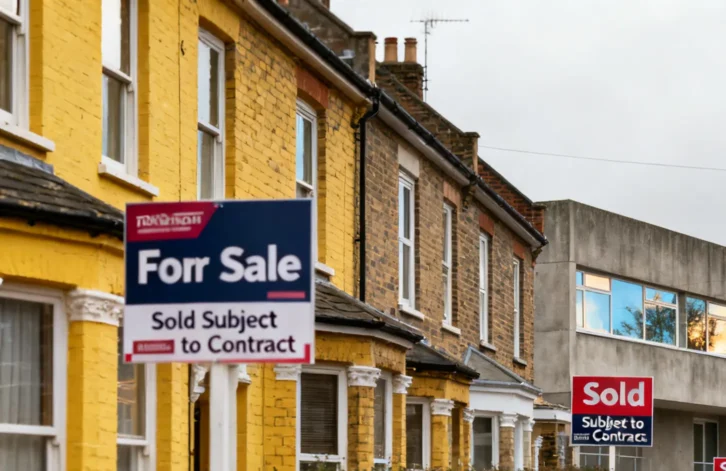
The UK property market showed signs of recovery in late July 2026, with weekly sales figures returning to 2024 levels after a difficult spring and early summer period, according to the latest market data.
In week 30, 24,700 homes sold subject to contract, bringing net sales back in line with 2024 figures. The data suggests July delivered a stronger finish than many market observers anticipated, though year-to-date performance remains below 2025 levels.
Annual comparison reveals mixed picture
Year-to-date figures show 740,000 UK homes sold subject to contract, representing a 7.1% decline compared to 2025. However, the figure remains marginally below 2024 levels at just 0.2% lower, and sits 10.8% higher than 2023 performance.
Net sales, which account for fall-throughs, reached 575,000 year-to-date, matching 2024 levels exactly whilst running 5.5% below 2025. The metric stands 13.2% ahead of 2023 and 4.3% above the 2017-2019 average.
Property economist Adam Lawrence from Properomics analysed the data, noting that whilst conditions remain challenging, underlying metrics show relative stability compared to recent years. The market context follows ongoing policy discussions around capital gains tax that have affected investor sentiment.
Stock levels and pricing dynamics
The market held 767,000 homes for sale as of 1st August 2026, compared to 763,000 twelve months prior. However, the sales pipeline stood at 487,000 homes, down from 508,000 in August 2025.
Price reductions affected 13.7% of homes for sale in July, down from 14.3% in June. The 2026 year-to-date average of 13% exceeds the six-year long-term average of 11.2%. The difference between listing prices and agreed sale prices stood at 14.2%, below the ten-year average of 16-17%.
Properties sold subject to contract in July averaged £345.41 per square foot, representing a 1.2% increase on twelve months prior and an 11.9% rise over five years.
Exchange rates and market efficiency
July saw 46,600 exchanges, though this figure is expected to rise to the mid-to-late 70,000s as delayed reporting comes through in August. Withdrawals totalled 43,500, meaning only 51.7% of homes leaving agents’ books actually exchanged and completed, below the seven-year average of 57.6%.
The fall-through rate stood at 24.3%, marginally below the decade average of 24.5%. In June, 5.07% of homes sold subject to contract fell through, below both the 2025 average of 5.3% and the ten-year average of 5.8%.
Rental market trends
The rental sector showed different dynamics, with average rents at £1,837 per calendar month in July 2026, slightly below July 2025’s £1,849. This represents a 27% increase from July 2021’s £1,446.
Rental stock availability reached 323,000 properties in July 2026, up from 319,000 in July 2025. New rental properties coming to market totalled 135,928 in July, compared to 128,821 in July 2025 and 111,080 in July 2022, suggesting increased supply despite regulatory changes affecting the sector.
The data indicates the market has stabilised relative to 2024 levels after underperforming in the first half of 2026, though whether this represents sustained momentum or seasonal variation remains to be seen in coming months.