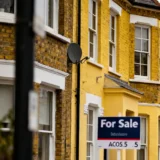
The total value of privately owned residential properties the UK has grown to over £5.5 trillion for the first time, according to new research.
In the last 10 years the total value has increased by 51% or £1.9 trillion to an estimated £5.6 trillion, a rise that has comfortably out-paced the retail price index, which rose by 33% during the period.
The data from the Halifax, one of the UK’s leading home landers, also shows that the average value per household in the UK now stands at £241,682, up from £173,837 in 2006, representing an increase of £67,845 or 39%.
The Halifax report says that this increase has been driven by a 51% rise in the average house price and the stock of privately owned homes expanding by 1.8 million from 21.3 million to 23.1 million.
More than half, some £1.1 trillion, of this rise is accounted for by London and the South East. Since 2006 the average house price in the capital has almost doubled at 98% whilst the stock of private dwellings has grown by a quarter of a million or 10%.
In the past year alone, the value of private housing stock grew by £337 billion, mainly reflecting average house price growth of 12% in the year to August.
‘The combined value of all privately owned houses in the UK is estimated at £5.6 trillion in 2016, the highest on record. A combination of higher house prices and an increase in the number of privately owned homes has seen the value of housing stock grow by £1.9 trillion in the past decade,’ said Martin Ellis, housing economist at the Halifax.
‘Overall housing equity held by UK households is in a healthy state, with total housing assets worth over £4.2 trillion more than the value of mortgage debt. Housing equity has grown by £1.6 trillion since 2006. For almost one in three home owners, who own their home with no outstanding mortgage debt, their financial position is even stronger,’ he added.
Details from the report show that the regions with highest growth in prices and the stock of private homes have seen largest value gains. There has been a healthy rise in the value of housing stock across all regions but especially in London and the South East where price growth has been the strongest combined with the largest rise in the stock of private dwellings.
The gains have been greatest in London where housing value has more than doubled at 106% from £655 billion to £1.3 trillion over the decade. The next largest increase was in the South East at 61% or £402 billion, followed by the East at 60% or £233 billion and Scotland at 51% or £114 billion.
The research also shows that the north/south gap has widened since 2006. The value of housing in southern England has increased two and half times faster than in the north at 70% compared to 27% over the past decade. As a result, the South’s share of total UK housing assets rose from 55% in 2006 to 62% in 2016.
The share of private housing wealth in London has grown from 30% to 37% during the same period. The total value of private residential housing stock in the capital is 14 times the level in Northern Ireland, which at £87 billion, is the lowest in the UK.
Overall UK housing equity remains strong with total mortgage debt a quarter of total housing value. Total mortgage debt has also grown, rising by 25% since 2006 from £1.1 trillion to £1.3 trillion. Nonetheless, the value of the private housing stock has increased by over seven times as much by £1.9 trillion compared with the £264 billion rise in mortgage debt.
The report explains that as a result housing equity, the difference between the value of the housing stock and total outstanding mortgage debt, has increased by £1.6 trillion or 60% over the decade from £2.6 trillion in 2006 to £4.3 trillion.
Regionally, there is a wide variation in the level of housing equity, with a higher balance in the south compared to northern areas. The highest is in London where housing equity is estimated at £916 billion, which is equivalent to £349,748 per household. The next largest is the South East at £830 billion or £255,965 per household and the East at £533 billion or £244,036 per household.
Outside southern England, the highest equity levels are in the North West at £307 billion, or £117,952 per household, the West Midlands at £273 billion or £139,620 per household and Scotland at £254 billion or £130,546 per household.