London’s housing market has been in a lull, with modest growth in average house prices and a large drop in transaction volumes, according to a new quarterly industry analysis report.
There has also been an overall decline in private housing rents but while demand and rents paid for flats dropped, there has been an increased demand for houses and an accompanying rise in rents paid.
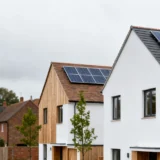
House building has also slowed, with fewer schemes passing through planning, and new build housing supply affected by cooling of buyer demand, according to the London Intelligence report published by the Centre for London.
It says that average house prices in greater London increased by 3.9% in the year to August 2018, to £623,677, following negligible growth between March and June. This compared to a much lower rate of annual change for the rest of England and Wales, at 1.1%.
But house prices across London are seeing slow growth, in contrast to the rapid growth that the housing market had become accustomed to. ‘Although political uncertainty has dented buyer confidence, prime central London appears resilient, showing signs of returning confidence,’ the report says.
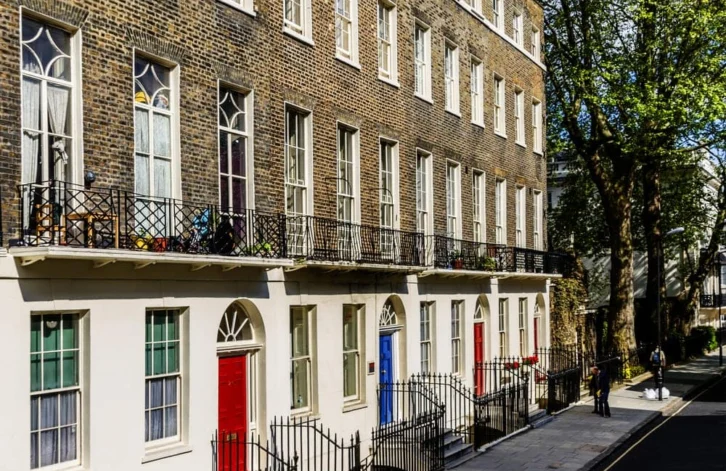
It also shows that prices in inner West London have seen the fastest growth, up by 13.8% in the year to August 2018, while house prices in outer West London have increased by 8.6% to £1.2 million. In inner East London the market has cooled, with a slower increase of 1.3% to £603,000 over the same period.
Sales in London fell further in the three months to August 2018. A total of 20,000 homes were bought and sold in the capital, down by 23% on the previous year. ‘There have been suggestions that this may be as a result of property speculators who buy and sell homes in quick succession shifting their focus north, while the market in London and the South cools,’ the report explains.
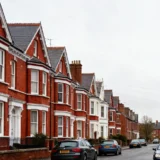
The report also points out that although there are noticeable signs of slowing since the 2016 European Union referendum, some property types are showing slight signs of recovery. For example, in the last three months sales of detached houses increased by 15%, sales of semi-detached houses increased by 23% and sales of terraced houses increased by 13%.
However, sales of flats, the most commonly bought property type in London, were down by 9% on a quarter on quarter basis.
In the lettings market rents fell by 0.3% in the 12 months to August 2018, although this is less sharp than the year previously, the report says, and there has been an average fall of 0.1% since the beginning of 2018. This is compared to an average 1.9% monthly growth in the rest of England.
However, data on actual rents paid in London show a slightly different picture. These figures show an improvement in London’s rental market, with average rents increasing 1.9% in the third quarter of 2018 when compared to the same period last year.
The report explains that this bucks a previous downward trend, which saw four consecutive quarters of decline. Larger houses saw the largest year on year increase, with terraced and detached housing showing significant increases while rents for flats were more subdued, possibly indicating oversupply of some property types.
Looking ahead, the report points out that the number of considered planning applications fell in the second quarter of 2018. Only 122 large residential schemes were decided on, down 17% on the same period last year.
‘Local elections in May of this year may help explain the slowdown in major scheme decisions, as fewer schemes passed through planning committees,’ it says. However, an increased proportion of those that did were granted, some 835 of large residential schemes, a rise of 7% on the previous quarter.
It also points out that unlike major schemes, most minor scheme decisions are taken by planning officers rather than planning committees, so the elections had less effect. The number of minor scheme decisions which were granted fell by 35 in the year to the second quarter of 2018, with those not granted falling by 13%.
While housing completions in the year to June 2018 slipped back below 23,000, the rate remains above the 10 year average. ‘However, new starts remain subdued, falling below 17,400 in the year to June 2018, suggesting that new build housing supply is slowing, responding to economic uncertainty, as well as cooling of buyer demand, as indicated by lower transaction volumes,’ it adds.