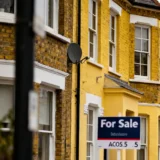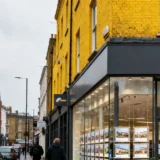
Average house price growth slowed year on year in England and Wales in December 2017 and was flat over the month, pulled down by a 4.1% annual fall in London, the latest index shows.
But elsewhere price increases were recorded year on year and only the South East, Yorkshire and the Humber and London saw prices fall month on month, according to the data from the Your Move house price index.
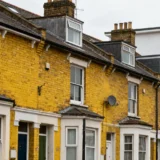
Prices ended up 0.2% higher, taking the average price of a home to £300,846, but this headline figure masks considerable growth outside of London, led by Bristol and the South West with prices up 8.9% and 5.3%.
Year on year prices increased by 3.9% in the North West to £189,490, in Wales by 3.6% to £180,819, in the West Midlands by 3.3% to £216,819, in the East Midlands by 3% to £206,937, in the East of England by 2.7% to £325,113, in Yorkshire and Humber by 1.7% to £185,827, in the South East by 1% to £369,398 and in the North East by 0.4% to £156,718.
The story was very different in London. There prices fell by 4.1% on an annual basis and by 0.4% month on month in December to an average of £587,640. Month on month prices also fell by 0.4% in the South East and by 0.1% in Yorkshire and the Humber.
Everywhere else saw prices rise month on month, led by the South West with a rise of 1.1%, followed by the North East up 0.9%, Wales up 0.8%, the North West up 0.6%, the East Midlands up 0.3%, the West Midlands up 0.2% and the East of England up 0.1%.
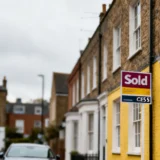
December marked the second month in a row that prices rose after several months of falls but the index report points out that the housing market does face challenges. Tax changes have hit demand from buy to let investors and numbers of first time buyers remain below the long term average although with stamp duty exemptions introduced for first time buyers in the last Budget, registrations are starting to look more promising.
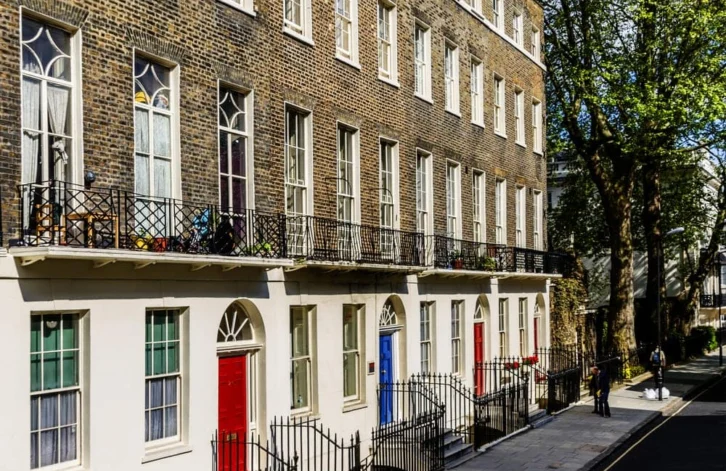
It is London that is seeing the biggest changes. Prices in Southwark were down by 21.1%, down 19.4% in the City of Westminster, down 13.6% in Hammersmith and Fulham, down 12.1% in Wandsworth and down 9.3% in Kensington and Chelsea, still the most expensive borough with average prices of £1,837,077.
What is clear is that, so far, is that declines in London are not at all reflected in other major cities in England and Wales. Many of them continue to set new peak average prices, led by growth of 8.9% annual in Bristol are up 8.9%, up 6.9% in Merseyside, up 5.6% in Southampton, up 4.4% in Cardiff and up 3% in Greater Manchester.