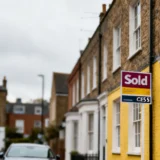
There has been no change in the number of people in England owning their own homes in the last three years and the private rented sector has stalled in the last 12 months, the latest official data shows.
Of the estimated 22.8 million households in England some 14.3 million or 63% were owner occupiers in 2015/2016 but this number has been falling since it peaked at 71% in 2003 and has not changed since 2013/2014, according to the latest English Housing Survey published by the Department of Communities and Local Government (DCLG).
While the overall rate of owner occupation has not changed in recent years, the composition of the group has with the figures showing that there are more outright owners and the proportion of those buying with a mortgage is down.
In 2015/2016 some 34% of households were outright owners while 29% were mortgagors. The figures also show that since 2013/2014 there have been more outright owners than mortgagors, and the proportion of mortgagors has declined from 31% of households to 29%.
The report suggests that the increase in the number and proportion of outright owners is at least partly explained by population ageing, with large numbers of baby boomers reaching retirement age, paying off their mortgages and moving into outright ownership.
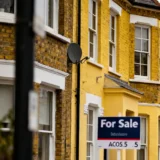
Overall the private rented sector remains larger than the social rented sector at 4.5 million households in 2015/2016 or 20% of households. The social rented sector accounted for 3.9 million households or 17% of households.
There was no change in the size of either sector between 2014/2015 and 2015/2016 but over the last decade, the number of families in the private rented sector has increased. Between 2005/2006 and 2015/2016 the proportion of households in the private rented sector with children increased from 30% to 36%.
The report points out that given the sizeable growth in the overall number of private renters over this period, this 6% increase equates to about 945,000 more households in the private rented sector with children.
Over the same 10 year period, the proportion of households in the social rented sector with children decreased from 36% to 32%, which translates to around 123,000 fewer households in the social rented sector with children.
The proportion of social renters who expect to buy has increased but no such increase was observed among private renters. In 2015/2016 some 59% of private renters or 2.6 million households and 27% of social renters, one million households, stated that they expected to buy a property at some point in the future.
Between 2014/2015 and 2015/2016 there was no change in the proportion of private renters who expected to buy however the proportion of social renters who expected to buy increased from 24% to 27%. Private renters spend a significantly greater proportion of their income on their housing costs than social renters or those buying with a mortgage.
On average, those buying their home with a mortgage spent 18% of their household income on mortgage payments whereas rent payments were 28% of household income for social renters and 35% of household income for private renters.
Meanwhile, about half of owner occupied households are under occupied. The number and proportion of under occupied households in the owner occupied sector increased between 1995/1996 and 2015/2016 from 39% or 5.3 million households to 52% or 7.4 million households.
In contrast, the proportion of under occupied households in the rented sectors decreased over the same period from 18% in 1995/1996 to 14% in 2015/2016 and under occupation amongst social renters decreased from 12% to 10%.
The proportion of dwellings with the highest energy efficiency rating has increased considerably in the last 10 years, particularly in the social rented sector. In 2015 some 28% of dwellings had an energy efficiency rating of A to C, up from just 5% of dwellings in 2005.
Some 48% of dwellings in the social rented sector had an energy efficiency rating of A to C compared with 26% in the private rented sector and 24% of owner occupied homes. While the majority of homes had at least one working smoke alarm, only about a quarter had a carbon monoxide alarm.
In 2015/2016 the vast majority, 89%, of households had at least one working smoke alarm, up from 84% in 2008/2009 and in 2015 28% of homes had a carbon monoxide alarm. Owner occupied dwellings at 31% were more likely than private rented at 21% or social rented dwellings at 28% to have a carbon monoxide alarm.