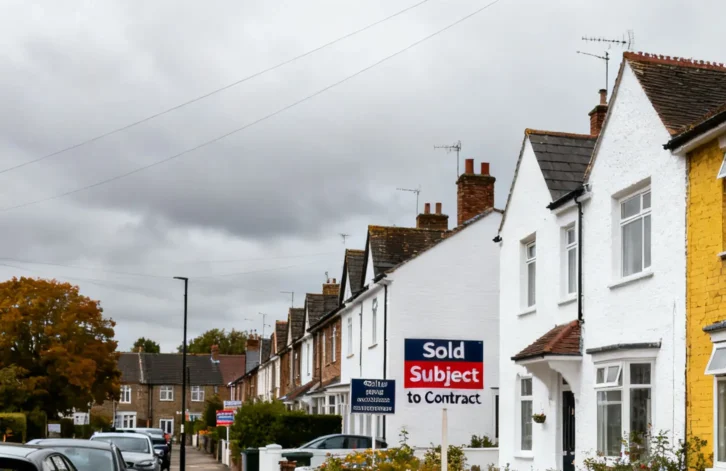
The UK property market recorded an 11% weekly decline in sales agreed during the week ending 9 August 2026, with 21,800 homes sold subject to contract compared to 24,700 the previous week, according to data from The Guild of Property Professionals.
The sharp drop follows two consecutive weeks of stronger-than-expected activity that had bucked normal seasonal trends. Whilst summer slowdowns are typical for the property market, the scale of this week’s decline has prompted questions about whether this represents seasonal adjustment or signals broader market weakness.
Year-to-date performance
Despite the weekly decline, year-to-date figures show 762,000 UK homes sold subject to contract, representing a 7.3% decrease compared to the same period in 2025 (821,000) and a marginal 0.7% decline versus 2024 (767,000). The figure remains 10.6% higher than 2023 and 6% above the pre-COVID 2017-19 average of 718,000.
New listings totalled 31,500 for the week, down from 32,800 the previous week and below the 2026 weekly average of 36,600. Year-to-date listings stand at 1.113 million, 0.3% lower than 2025 but 3.4% ahead of 2024 levels.
Market indicators
Net sales, which account for fall-throughs, reached 16,900 for the week compared to 19,000 the previous week. The fall-through rate stood at 22.4%, below the decade average of 24.5%.
Stock levels remained relatively stable at 767,000 homes on the market as of 1 August 2026, compared to 760,000 the previous month and 763,000 twelve months prior. However, the sales pipeline decreased to 487,000 homes from 508,000 in August 2025.
Price reductions affected 21,200 properties during the week. In July, 13.7% of homes for sale experienced price cuts, down from 14.3% in June but above the six-year average of 11.2%. This trend aligns with recent data showing investors securing larger discounts in the current market environment.
Pricing and rental data
The average difference between asking prices of new listings and sold properties stood at 9.9%, significantly below the 10-year average of 16-17%. July 2026 agreed sales averaged £345.41 per square foot, representing a 1.2% increase year-on-year and an 11.9% rise over five years.
The rental sector showed continued growth, with average rents reaching £1,832 per calendar month in week 31, compared to £1,800 in August 2025. Rental stock availability increased to 323,000 properties in July 2026 from 319,000 the previous year, whilst new rental properties coming to market rose to 135,928 from 128,821 in July 2025.
Exchange completion rates
July 2026 recorded 65,500 exchanges, though this figure is expected to rise to the mid-to-late 70,000s as more transactions are reported. Withdrawals totalled 63,400, resulting in only 50.8% of homes leaving agents’ books completing successfully, below the seven-year average of 57.6%.
The data comes as UK house prices show modest growth amid broader market uncertainty, with industry forecasters adjusting their expectations. The sell-through rate for June stood at 14.2%, below the pre-COVID average of 15.5%.
Market observers note that a single week’s data does not establish a trend, particularly following two stronger weeks. However, the scale of the decline warrants monitoring by estate agents, sellers and buyers in the coming weeks to determine whether this represents temporary seasonal adjustment or the beginning of sustained softening in transaction volumes.