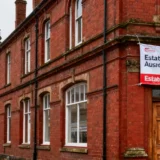

Research by next-generation guided virtual property viewings platform, U-See Homes, has highlight how using virtual tour tech to market and sell homes increases their value by more than £14,000 when compared to homes that don’t make use of this rapidly emerging technology.
Previous research from TwentyCi has revealed that virtual tours add an average of 5.6 per cent to the sale value of a house and, in the world of lettings, can add 8.5 per cent to monthly rental income for landlords.
U-See Homes has crunched the numbers on the current UK sales and lettings sectors to reveal exactly what that means in pounds and pence for both landlords and home seller, as well as sales and lettings agents, throughout the UK’s booming housing market.
In the UK sales market, the average home now comes in at £256,405. Using virtual tours to market a home of this value could increase the price achieved by £14,410, bringing the overall sold price to £270,815.
The more valuable a property, the more valuable virtual tours become. Home sellers in London, where the average house price is the highest of all UK regions (£500,310), could utilise this technology to add a remarkable £28,117 to the value of their home.The North East of England has the UK’s lowest average house price of £145,893, but despite this, virtual tours could still add £8,384 to the value of the average home in the region.
Lettings
In the lettings market, virtual tours have proven equally powerful.
Across the UK, the average monthly rent currently sits at £997. By using virtual tours to market these properties, landlords can add £85 to their monthly rental income, a vital boost in a sector that has seen profits hit by a string of government legislative changes.
The UK’s most expensive rental market and by some distance is again, London. The average monthly rent in the capital is a hefty £1,583 but making the most of virtual tour tech could add a further £135.
Even in the North East, the UK’s most affordable lettings market, virtual tours could add as much as £48 to the average monthly rental income of £560.
Simon Dempsey, head of marketing for U-See Homes, said: “The added value that guided virtual tours can offer to both homeowners and landlords is evident but they’re only able to utilise this technology if their agent of choice offers it. However, our previous research found that just 4 per cent of homes listed for sale across the UK’s major cities make use of virtual viewings tech. There is now the ability to deliver unrivalled real-time guided viewing experiences online, without compromising on traditional face-to-face interaction. In turn, this will save time, money and increase viewing potential, the technology is now so simple to set up & use, small points of difference now will pay huge dividends in the future. Higher selling and rental prices mean a greater degree of income for the agent and so it’s surprising that so few of them are using virtual tours, given that the cost of acquiring the technology could soon be earned back through the additional income generated.”
| Sales | ||||
| Location | Average house price | VT sales boost per cent | VT sales boost £ | VT average house price |
| United Kingdom | £256,405 | 5.62 per cent | £14,410 | £270,815 |
| England | £274,615 | 5.62 per cent | £15,433 | £290,049 |
| London | £500,310 | 5.62 per cent | £28,117 | £528,428 |
| South East | £348,615 | 5.62 per cent | £19,592 | £368,207 |
| East of England | £315,059 | 5.62 per cent | £17,706 | £332,766 |
| South West | £287,650 | 5.62 per cent | £16,166 | £303,816 |
| West Midlands region | £220,982 | 5.62 per cent | £12,419 | £233,401 |
| East Midlands | £219,950 | 5.62 per cent | £12,361 | £232,311 |
| Yorkshire and the Humber | £188,575 | 5.62 per cent | £10,598 | £199,173 |
| North West | £187,924 | 5.62 per cent | £10,561 | £198,485 |
| Wales | £185,431 | 5.62 per cent | £10,421 | £195,852 |
| Scotland | £166,566 | 5.62 per cent | £9,361 | £175,927 |
| Northern Ireland | £149,178 | 5.62 per cent | £8,384 | £157,562 |
| North East | £145,893 | 5.62 per cent | £8,199 | £154,092 |
| Sources | UK House Price Index – March 2021 (latest available) | TwentyCI | VT premium applied to average house price | |
| Lettings | ||||
| Location | Average rent pm | VT letting boost per cent | VT letting boost £ | VT average rent pm |
| United Kingdom | £997 | 8.50 per cent | £84.75 | £1,082 |
| England | £903 | 8.50 per cent | £76.76 | £980 |
| London | £1,583 | 8.50 per cent | £134.56 | £1,718 |
| South East | £1,095 | 8.50 per cent | £93.08 | £1,188 |
| East of England | £1,001 | 8.50 per cent | £85.09 | £1,086 |
| South West | £943 | 8.50 per cent | £80.16 | £1,023 |
| North West | £790 | 8.50 per cent | £67.15 | £857 |
| West Midlands region | £755 | 8.50 per cent | £64.18 | £819 |
| Scotland | £707 | 8.50 per cent | £60.10 | £767 |
| East Midlands | £704 | 8.50 per cent | £59.84 | £764 |
| Wales | £698 | 8.50 per cent | £59.33 | £757 |
| Yorkshire and the Humber | £697 | 8.50 per cent | £59.25 | £756 |
| Northern Ireland | £678 | 8.50 per cent | £57.63 | £736 |
| North East | £560 | 8.50 per cent | £47.60 | £608 |
| Sources | HomeLet – May 2021 (latest available) | TwentyCI | VT premium applied to average rental price | |