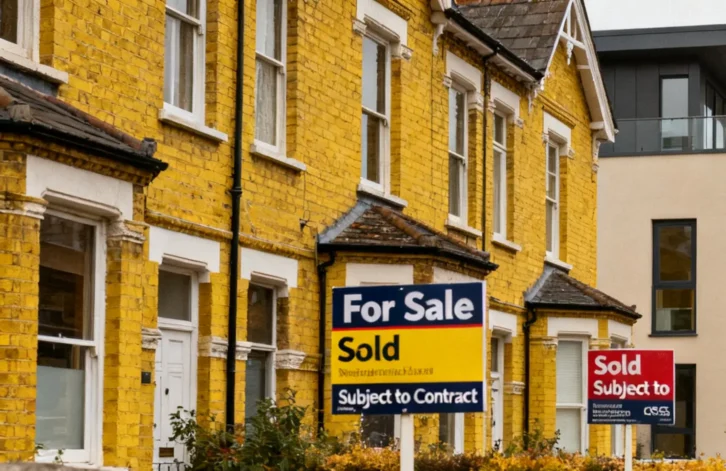
The UK property market continues to record significant transaction volumes despite widespread negative sentiment following the recent Budget, according to the latest market data analysed by property analyst Chris Watkin.
Year-to-date figures show 1.032 million UK homes have sold subject to contract, representing a 10.6% increase compared to 2023 and 4.1% higher than the pre-Covid 2017-19 average. However, sales remain 7.5% lower than 2025 and 3.6% below 2024 levels.
New listings remain above historical averages
New property listings totalled 1.529 million year-to-date, marginally below 2025’s 1.532 million but 8.8% higher than 2023 and 8.8% above the 2017-19 average. Week 43 saw 27,500 new listings, slightly below the 10-year average of 28,900 for the same period.
Stock levels have risen to 758,000 homes on the market as of 1 November 2026, up from 742,000 in November 2025 and 664,000 in November 2023, suggesting increased supply in the market.
Price reductions and exchange rates signal market friction
The data reveals challenges in pricing strategy, with 13.7% of UK homes for sale reduced in October, down from 14.7% in September but above the seven-year average of 11%. The difference between initial asking prices and agreed sale prices stood at 15.5% in week 43, below the long-term average of 16-17%.
Exchange rates remain concerning, with just 49.2% of homes leaving agents’ books in October completing via exchange, whilst 50.8% withdrew unsold. This compares unfavourably to the seven-year average exchange-to-listings ratio of 57.6%. The broader property sector has faced challenges, with major developers adjusting their operational footprints.
Rental market shows mixed signals
Average rents stood at £1,767 per calendar month year-to-date in 2026, with October’s monthly average at £1,804, down from £1,880 in October 2025. Rental stock availability remained relatively stable at 320,000 properties on 1 November 2026, compared to 323,000 the previous year.
New rental properties entering the market totalled 149,700 in October 2026, down from 153,000 in October 2025 but significantly higher than the 116,000 recorded in October 2022.
Regional focus highlights agent performance variations
The analysis included a detailed examination of the Weybridge market, comparing agent performance metrics including price achievement and sell-through rates. While specific Weybridge figures were not disclosed, the methodology highlighted variations in agent effectiveness across pricing accuracy and time-to-sale metrics.
House prices measured at £338.98 per square foot for September 2026 agreed sales showed minimal movement, up just 0.2% year-on-year but 13.7% higher than five years prior. This metric, which Watkin notes correlates with HM Land Registry data at 98% accuracy five months in advance, suggests price stability in the market.
The fall-through rate stood at 23.99% in week 43, marginally below the decade average of 24.5%, whilst the monthly rate of 5.2% for September 2026 remained close to the 10-year average of 5.7%. These figures contrast with regional variations in affordability across different UK markets.
The sell-through rate of 13.4% for October 2026 remained below the pre-Covid average of 15.5%, indicating properties are taking longer to sell despite continued market activity. Net sales, accounting for fall-throughs, totalled 795,000 year-to-date, 6.5% lower than 2025 but 13.7% ahead of 2023.