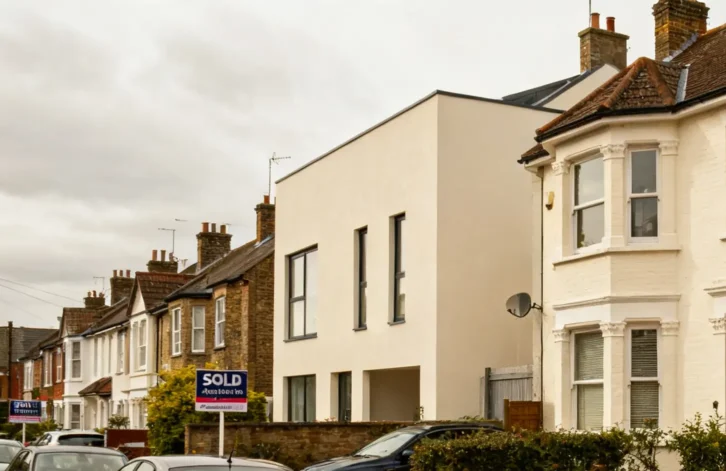
The UK property market continues to operate above pre-pandemic levels despite a shift in market dynamics that has placed increased pressure on pricing strategies, according to the latest market data for the week ending 30th August 2026.
Year-to-date figures show 832,000 homes have been sold subject to contract, representing a 5.7% increase compared to the 2017-2019 average of 789,000. However, this marks a 6.8% decline from the same period in 2025, when 893,000 properties were sold.
Pricing strategy emerges as key factor
The data reveals that approximately 80% of sellers who successfully completed sales in 2026 did so without reducing their initial asking price. This suggests that pricing accuracy at the point of listing has become increasingly critical in a market where buyers have more options available.
In August 2026, 97,900 sales were agreed, down from 104,500 in August 2024 and 104,400 in August 2025, but still ahead of the 87,600 recorded in August 2023. The average asking price for properties that went under offer stood at £349,000, compared to an average listing price of £393,000, representing a 12.6% difference.
Stock levels and market activity
New listings totalled 33,400 for week 34, bringing the year-to-date total to 1.231 million, matching the same period in 2025. This figure sits 10% higher than the 2017-2019 average. Current stock levels show 767,000 homes on the market as of 1st August 2026, similar to the 763,000 available 12 months prior.
The sell-through rate reached 14.2% in July 2026, up from 13.8% in June, though still below the pre-Covid average of 15.5%. Meanwhile, the fall-through rate stood at 23.7%, below the decade average of 24.5%.
In July 2026, only 51.3% of homes that left agents’ books completed exchanges, with the remaining 49% withdrawn unsold. This compares to a seven-year average exchange-to-listings ratio of 57.6%.
Regional variations and rental market
Price per square foot for agreed sales averaged £345.41 in July 2026, marking a 1.2% increase from £341.43 twelve months earlier and an 11.9% rise from five years ago. The data analysed regional variations, with a specific focus on Oldham in the North West.
The rental market showed average rents of £1,788 per calendar month in August 2026, marginally down from £1,800 in August 2025 but significantly higher than the £1,394 recorded in August 2021. Rental stock availability increased slightly to 323,000 properties in August 2026, compared to 319,000 the previous year.
New rental properties coming to market totalled 135,928 in August 2026, up from 128,821 in July 2025. This increase in rental supply comes as proptech firms develop new pricing tools to help landlords navigate market conditions.
Market outlook
The data indicates a functioning market operating with higher inventory levels than historical averages, creating a more selective environment for buyers. Price reductions affected 13.7% of homes for sale in July, down from 14.3% in June but above the six-year average of 11.2%.
While transaction volumes have softened compared to 2025, the market continues to outperform 2023 levels and remains ahead of pre-pandemic activity. However, with property condition concerns affecting buyer decisions and ongoing economic uncertainty, pricing strategy appears to have become the determining factor in sales success.
The market’s performance occurs against a backdrop of broader economic considerations, including ongoing debates about property taxation that may influence future market conditions.