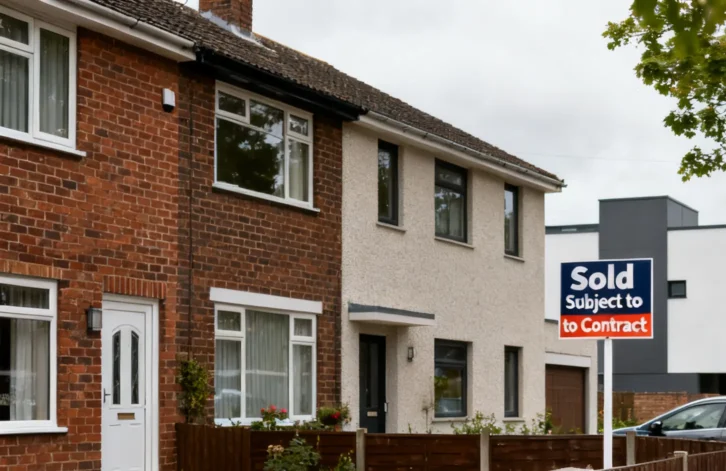
UK property sales recovered in the week ending 16 August 2026, with 24,400 homes sold subject to contract, up from 21,700 the previous week, according to market data released this week.
The figures suggest the previous week’s decline may have been attributable to seasonal factors including holiday periods and warm weather rather than underlying market weakness. The Week 32 total brings sales closer to the 10-year average of 25,200 for this period.
Year-to-date performance
Year-to-date figures show 786,000 UK homes sold subject to contract, representing a 7.1% decrease compared to the same period in 2025, when 846,000 properties were sold. However, the figure remains 6% higher than the pre-pandemic 2017-19 average of 742,000.
New listings totalled 32,600 for the week, up from 31,500 the previous week but below the 2026 weekly average of 36,400. Year-to-date listings stand at 1.166 million, marginally lower than 2025’s 1.169 million but 3.2% ahead of 2024.
Price sensitivity and withdrawal rates
The data reveals continued price sensitivity in the market, with approximately half of homes leaving estate agents’ books in July withdrawing unsold rather than exchanging. In July 2026, 79,600 properties exchanged whilst 76,300 withdrew, meaning only 51% of properties leaving the market completed sales, below the seven-year average of 57.6%.
Four out of five homes listed and sold in 2026 achieved sales without price reductions. The average difference between initial listing prices and agreed sale prices stood at 9.9%, significantly below the long-term average of 16-17%. Properties achieving sales agreed averaged £345.41 per square foot in July 2026, representing a 1.2% increase year-on-year.
Rental market trends
In the rental sector, average rents reached £1,805 per calendar month in August 2026, marginally higher than £1,800 in August 2025. This represents a 29.5% increase from August 2021, when average rents stood at £1,394. The data comes as rental listings in some regions have shown significant annual increases.
Available rental stock totalled 323,000 properties in July 2026, up from 319,000 in July 2025. New rental properties coming to market numbered 135,928 in July 2026, compared to 128,821 in July 2025 and 111,080 in July 2022. The increase in supply follows recent investment activity in the lettings sector.
Market stock levels
Total stock levels stood at 767,000 homes on 1 August 2026, compared to 760,000 the previous month and 763,000 twelve months prior. The sales pipeline contained 487,000 homes, down from 508,000 on 1 August 2025.
The sell-through rate, measuring the proportion of listed homes achieving sales, reached 14.2% in June 2026, up from 13.8% in June 2025 but below the pre-pandemic average of 15.5%. The fall-through rate stood at 25.7%, marginally above the decade average of 24.5%.
The data indicates a market characterised by modest activity levels and heightened price sensitivity, with seasonal fluctuations affecting weekly performance. Year-to-date figures suggest a stabilising market operating below 2025 levels but above pre-pandemic norms.