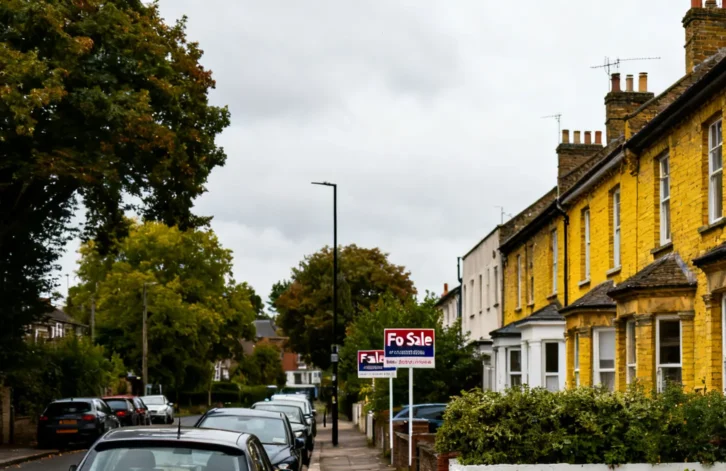
The UK housing market may be stabilising after several months of subdued activity, with July figures indicating that the slowdown in sales has eased. The annual gap in agreed sales narrowed to 5.2% last month, after running approximately 10% behind 2025 levels since Easter.
Net sales, which account for fall-throughs, have strengthened over the past fortnight, contrary to the seasonal trend of activity slowing during summer. Whether this represents a sustained recovery or a temporary improvement remains uncertain.
Regional performance
Across the UK, the number of homes sold subject to contract in July was 5.2% lower than in July 2025, yet 13.6% higher than in July 2023, when the market was affected by rising mortgage rates and weakened buyer confidence.
Scotland was the only region to record annual growth, up 0.3% against July 2025 and 15.7% compared with 2023. The North West recorded the largest annual decline at 9.5% compared with 2025, though activity remained 15.3% above 2023 levels.
The East of England showed the strongest three-year improvement, up 21.1% compared with July 2023, despite being down 2.7% on 2025. London was the weakest performer, down 4.4% against 2025 and only 5.6% ahead of 2023.
Year-to-date figures
Year-to-date figures show 715,000 UK homes sold subject to contract, 7.1% lower than 2025 but identical to 2024 and 10.7% higher than 2023. Net sales year-to-date stand at 556,000, down 5.5% on 2025 but 12.9% ahead of 2023.
New listings totalled 33,600 in week 29, slightly below the weekly 2026 average of 36,900. Year-to-date listings reached 1.069 million, identical to 2025 and 11.4% higher than the 2017-19 average.
Market conditions
In June 2026, only 50.8% of homes that left agents’ books exchanged and completed, with the remainder withdrawn unsold. This compares unfavourably with the seven-year average exchange to listings ratio of 57.6%.
Price reductions affected 14.3% of UK homes for sale in June, up from 13.4% in May and above the 2026 year-to-date average of 12.9%. The long-term six-year average is 10.7%. The difference between listing asking prices and sale agreed asking prices stood at 11.3%, below the 10-year average of 16-17%.
The market dynamics suggest buyers have more choice and are selective about pricing. The figures indicate a cooling from 2025 levels but conditions considerably stronger than those experienced in 2023, when the market faced challenges from monetary policy pressures.
The data suggests a more selective market where pricing and presentation are increasingly important factors in achieving sales, rather than indicating a market in crisis.